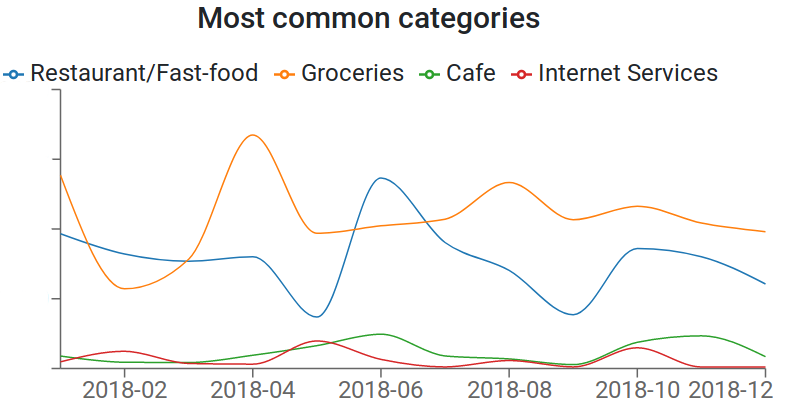
This graph shows my four most common expense categories during 2018 and how they changed from month to month. It is a screenshot from one of the charts in OTB, a bank transaction analysis tool that I have been working on for a while.
OTB was created to fulfill my need for seeing what expense categories I spend my money on. Although a lot of apps can do this, I had some special use cases that were not quite being solved by existing solutions. On top of that, it concerned me a bit to hand over my bank transactions to a 3rd party, even though some financial apps are regulated and have good security.
Privacy might actually be the main feature of OTB at this point. All the data (transactions, categories, etc.) are kept in the browser only, instead of storing the data in the cloud. It is thus impossible for the data to leak, unless the browser itself is compromised.
I have been using OTB regularly for a few months now. I have added and categorized 3840 bank transactions from two different banks in two different currencies (DKK/SEK), stretching back 3-6 years. A simple machine learning algorithm helps select categories, and when I add new transactions (which I do once or twice per month), I usually have to categorize 3-7 transactions by hand, and the rest (anywhere between 20 and 100 transactions) are correctly guessed by the algorithm, because my purchasing patterns are quite regular from month to month.
To be honest, the app is a bit messy, and not at all user-friendly, but I am happy with the outcome of the project so far, since it has actually started to become useful to me. For example, the chart at the beginning of this post shows, among other things, that I spent more on eating out in February and June than I spent on groceries. This is the kind of insight I was hoping to get from the app when I started working on it, and there is a lot of room for improvement.
I could go into a lot more detail about why I created OTB, what the limitations and trade-offs were in the design, and what I plan hope to do next, but I will save this for another time :-)
For now, feel free to check out OTB or take a look at the source code.